Dispersion studies
Measure how water—and what it carries—spreads
Deploy clusters of GNSS-tracked Lagrangian drifters to observe transport pathways, separation rates, spreading, retention, and exchange in coastal and open-ocean waters.
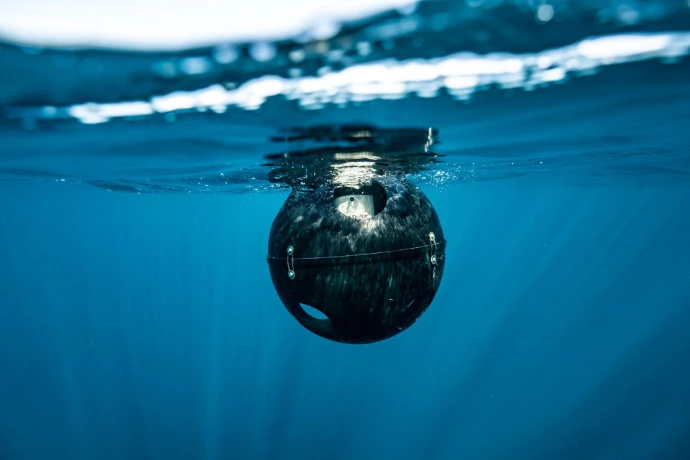
Move beyond a single trajectory
One drifter shows a pathway. Multiple drifters released with known spacing show how rapidly neighboring water parcels separate and how a release spreads through time.
Absolute dispersion describes movement away from a release location or reference point. Relative dispersion describes separation within a drifter cluster. Together, these observations help characterize transport, mixing, uncertainty, and the spatial footprint of a release.
Outfalls and discharges
Observe near-field and far-field transport pathways from rivers, outlets, and coastal discharge locations.
Pollutant response
Measure the water-motion component relevant to oil, contaminants, harmful algal blooms, and other floating or suspended material.
Biological transport
Quantify physical pathways and spreading associated with larvae, plankton, propagules, and habitat connectivity.
Model evaluation
Compare observed trajectory envelopes and separation rates with particle-tracking model predictions.
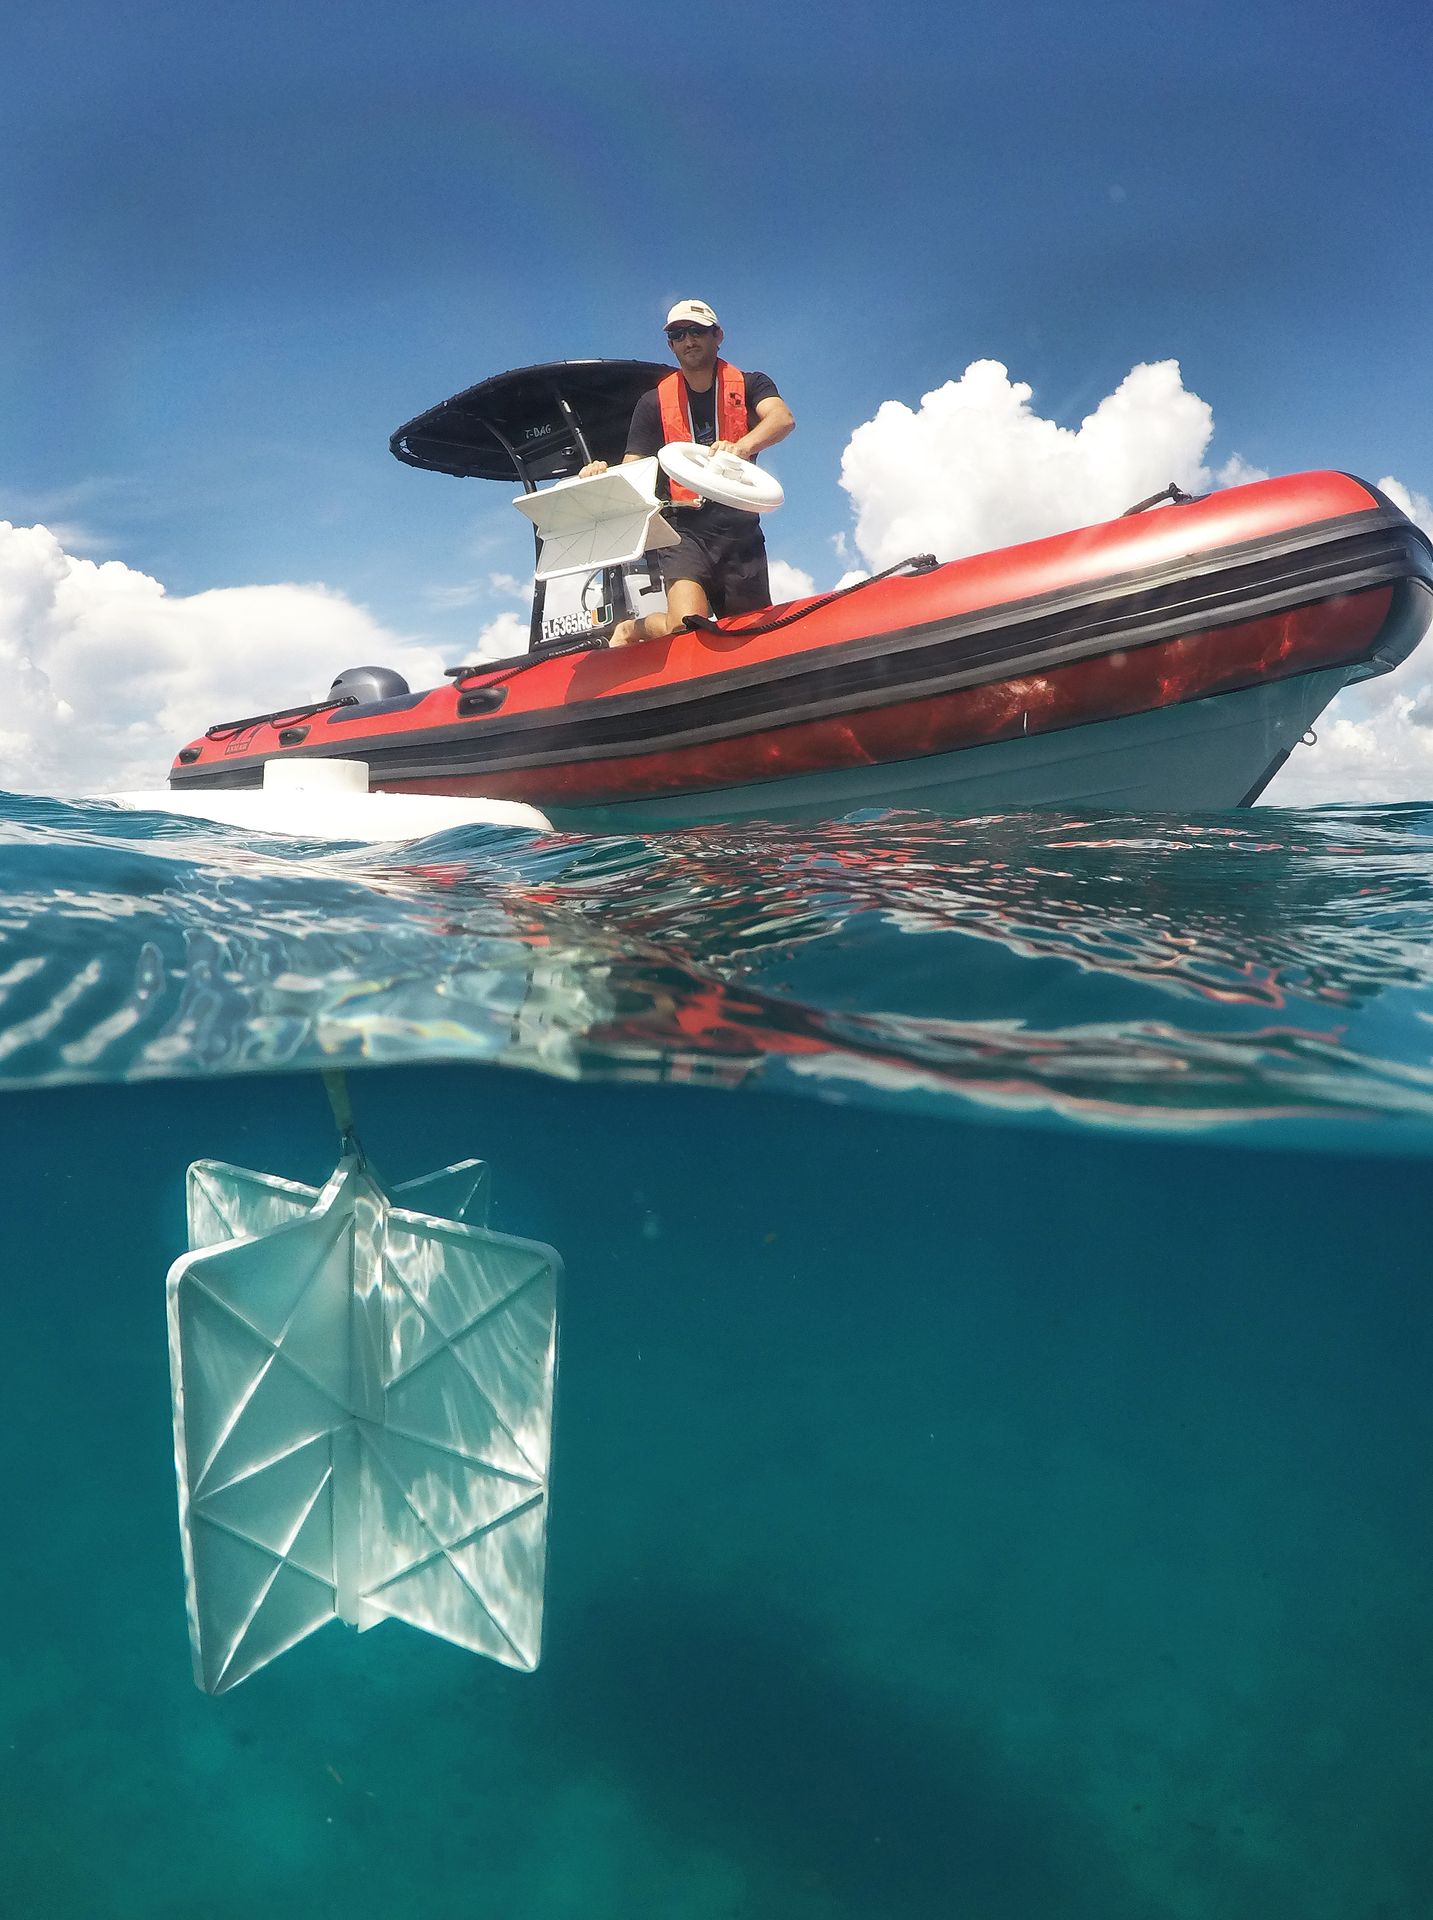
Match the drifter to the material or water layer
A useful dispersion study starts by identifying what the drifter should represent.
Surface oil, floating debris, larvae, and subsurface water parcels do not respond identically to currents, wind, waves, buoyancy, or biological behavior. Select the platform, drogue depth, and release strategy to reproduce the physical transport component most relevant to the study.
Design the release to answer the dispersion question
Define the target
Identify the water layer or transported material the drifters should approximate.
Set the array geometry
Choose cluster size, initial spacing, transects, replicates, and release timing for the expected scales.
Select the reporting rate
Use a sampling interval short enough to resolve the processes of interest while meeting service-life requirements.
Plan analysis and recovery
Define metrics, model comparisons, deployment duration, and recovery strategy before field work begins.
From tracks to evidence
Use the array to quantify transport and spreading
GNSS trajectories support multiple complementary measures of dispersion and model performance.
Centroid motion
Track the overall movement of the release or drifter cluster.
Pair separation
Measure how distances between neighboring drifters change through time.
Spreading footprint
Estimate the changing area and shape occupied by the array.
Model skill
Compare predicted and observed pathways, envelopes, timing, and separation.
Choose a platform for the target depth and environment
Pacific Gyre drifters cover tetherless near-surface studies through deeper mixed-layer experiments.
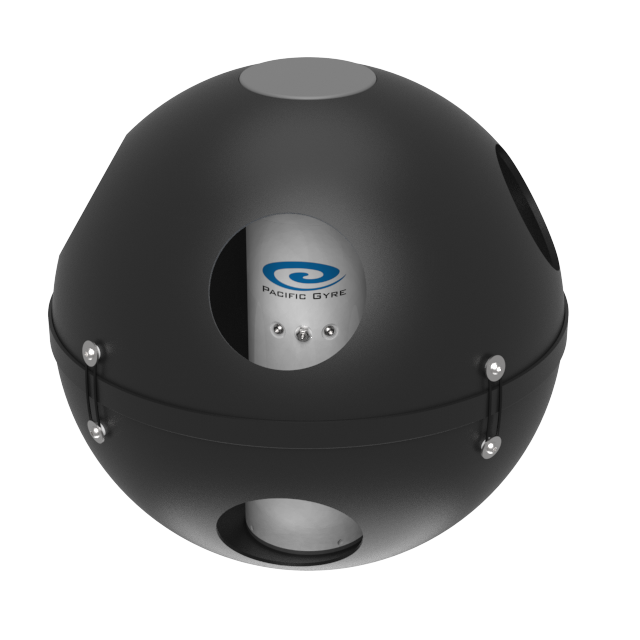
Approximately 20 cm
Reef Drifter
A tetherless design for shallow near-surface dispersion where conventional drogues could snag on reefs or underwater obstructions.
View Reef Drifter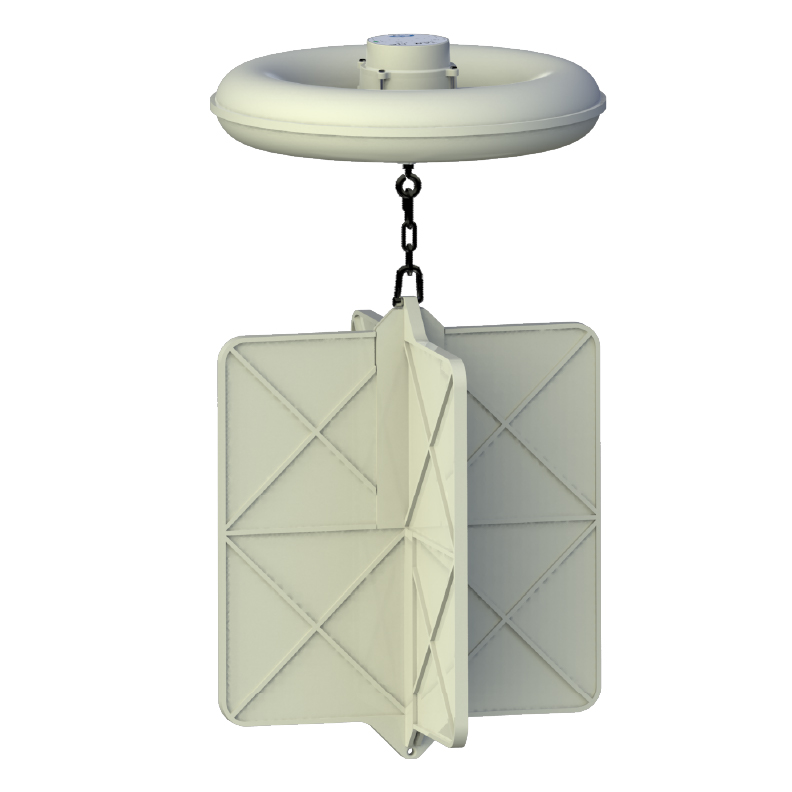
Currents centered at 40 cm
CARTHE Drifter
A low-cost platform suited to large coordinated arrays for coastal transport and relative-dispersion experiments.
View CARTHE Drifter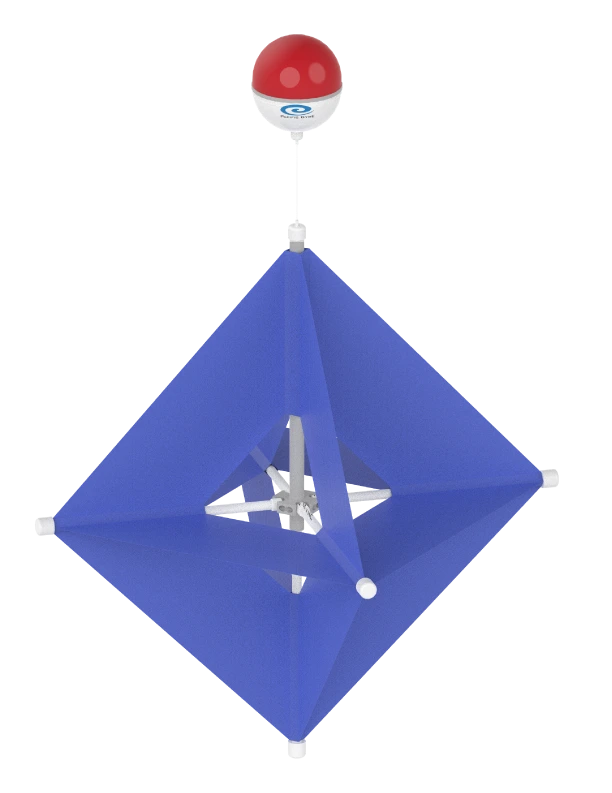
Drogue centered at 1 meter
Microstar Drifter
A compact drogued platform for coastal and shallow-water circulation and dispersion measurements.
View Microstar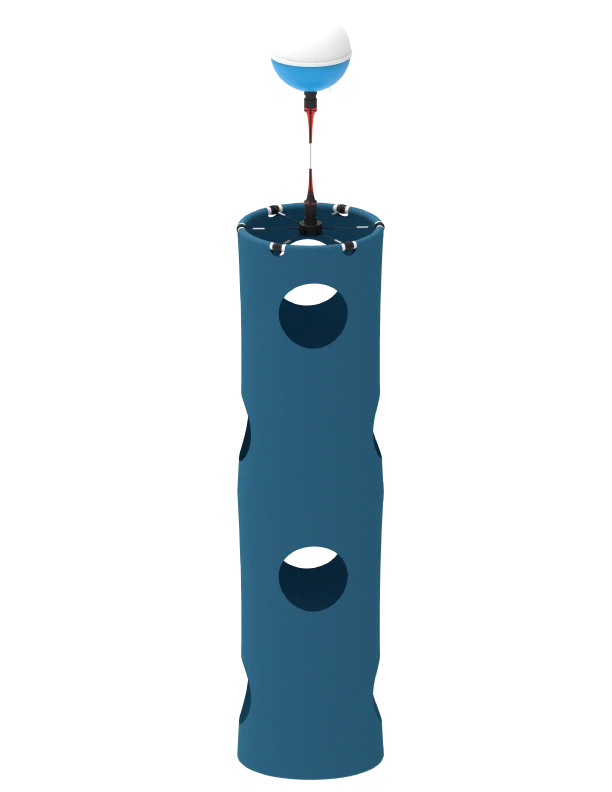
Standard 15 m; configurable depth
SVP Drifter
A robust drogued platform for open-ocean and mixed-layer transport and dispersion studies.
View SVP DrifterTelemetry and analysis
Follow the spreading array during field operations
Pacific Gyre's data system receives positions and device status, displays the array on a browser-based map, and archives observations for later analysis.
Download data through the browser or API for use in GIS, MATLAB, Python, spreadsheets, dashboards, and particle-tracking workflows.
Explore data services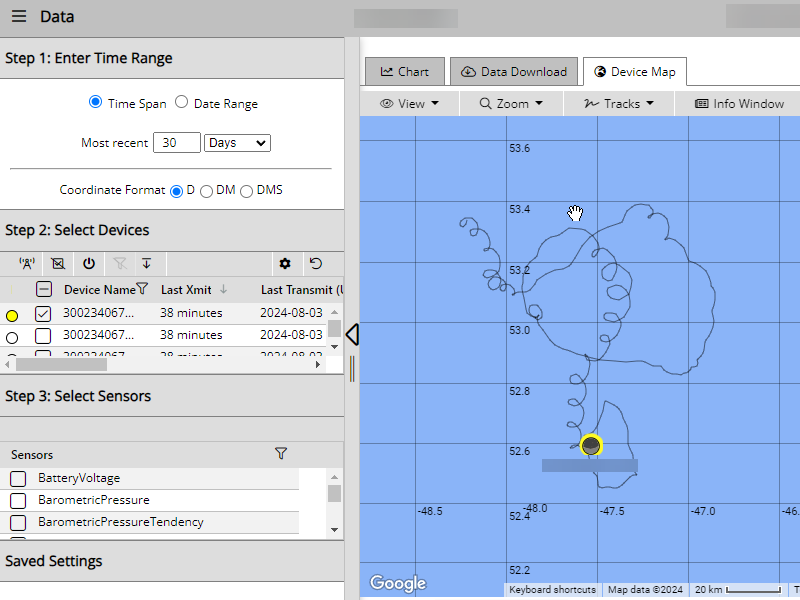
Plan a dispersion experiment at the right scale and depth
Tell us what you need to represent, the environment, expected spatial and time scales, array size, reporting rate, and deployment duration. We will help configure an appropriate platform.